Map Renderers &


Wed Jul 29 2015


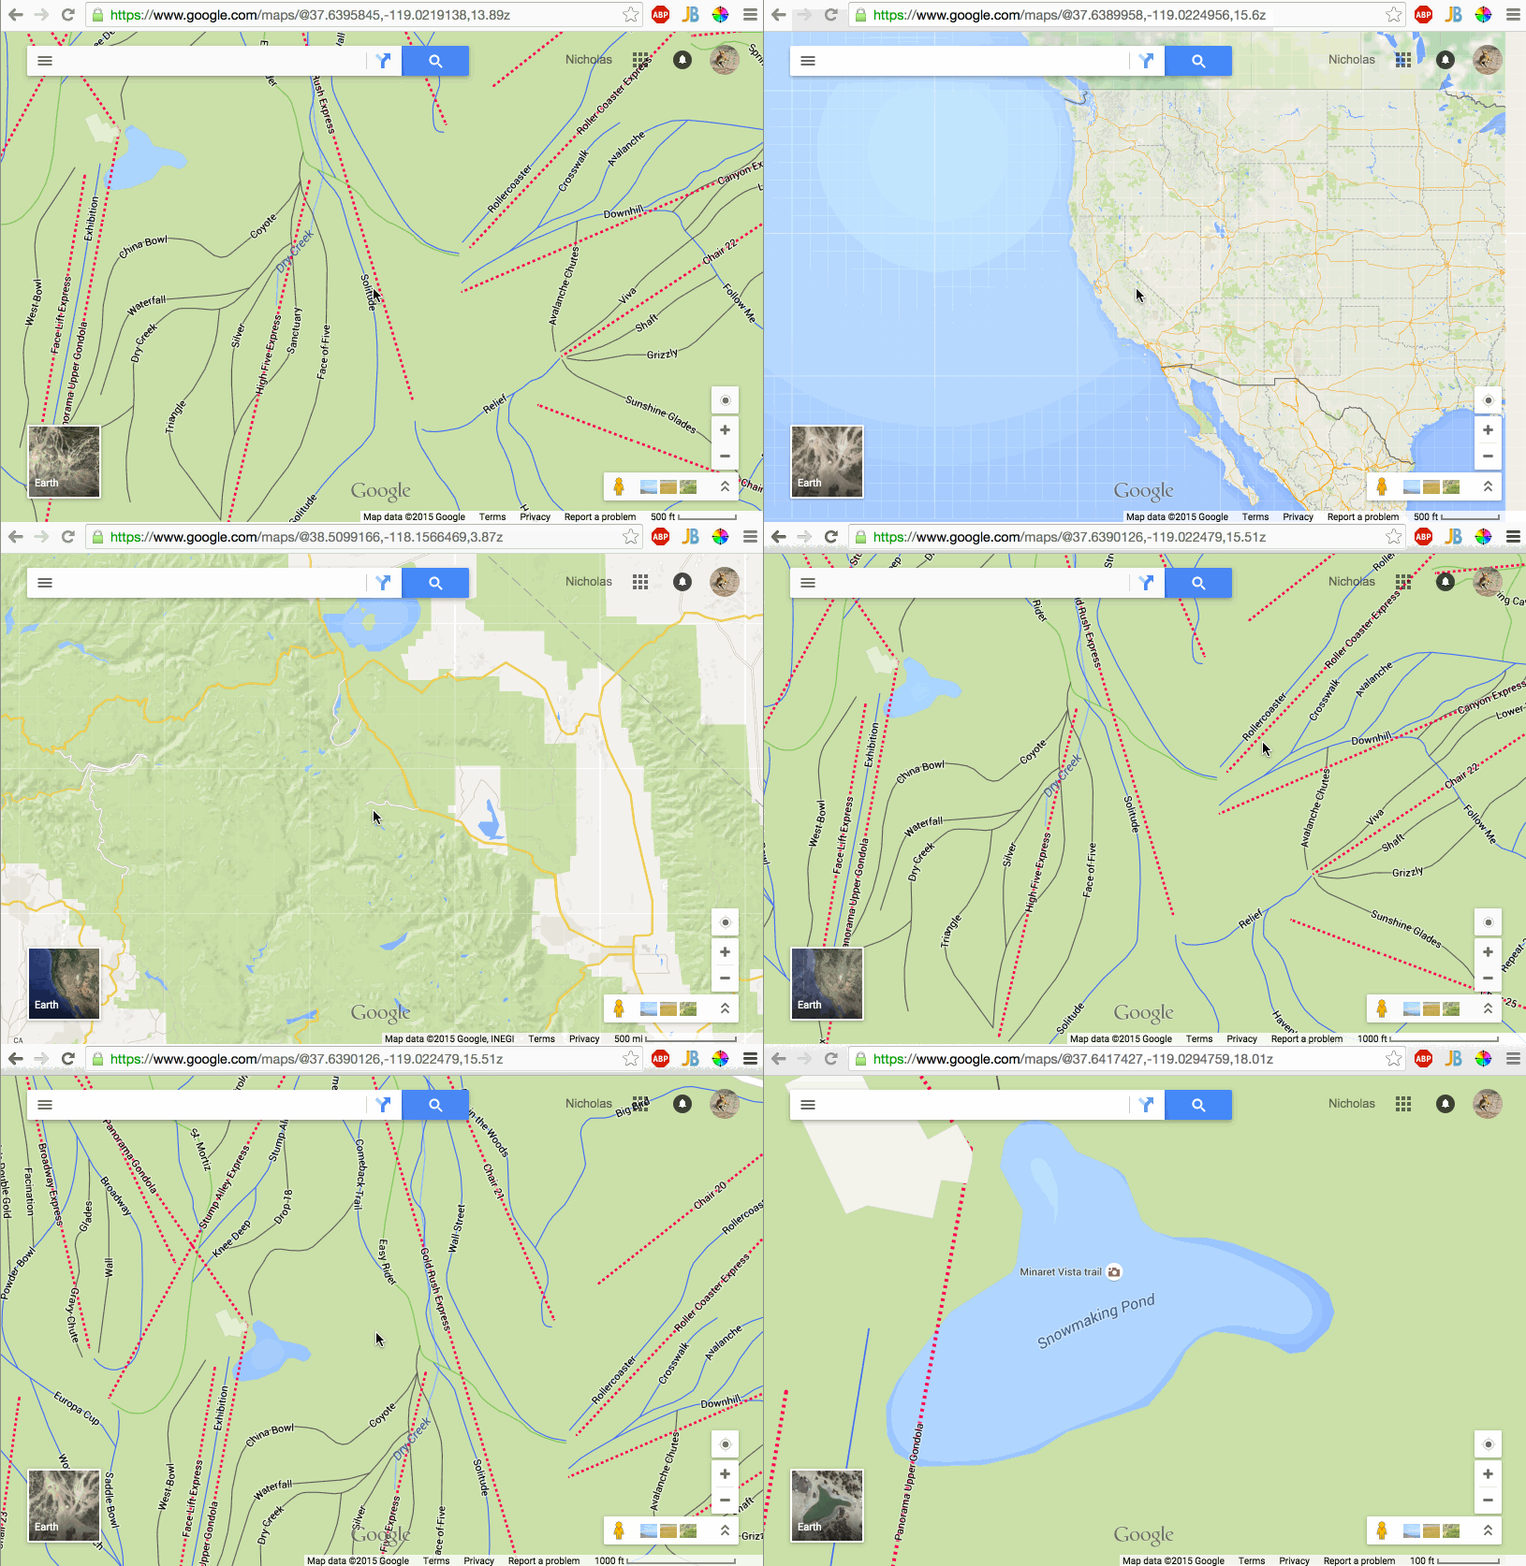
Google Maps


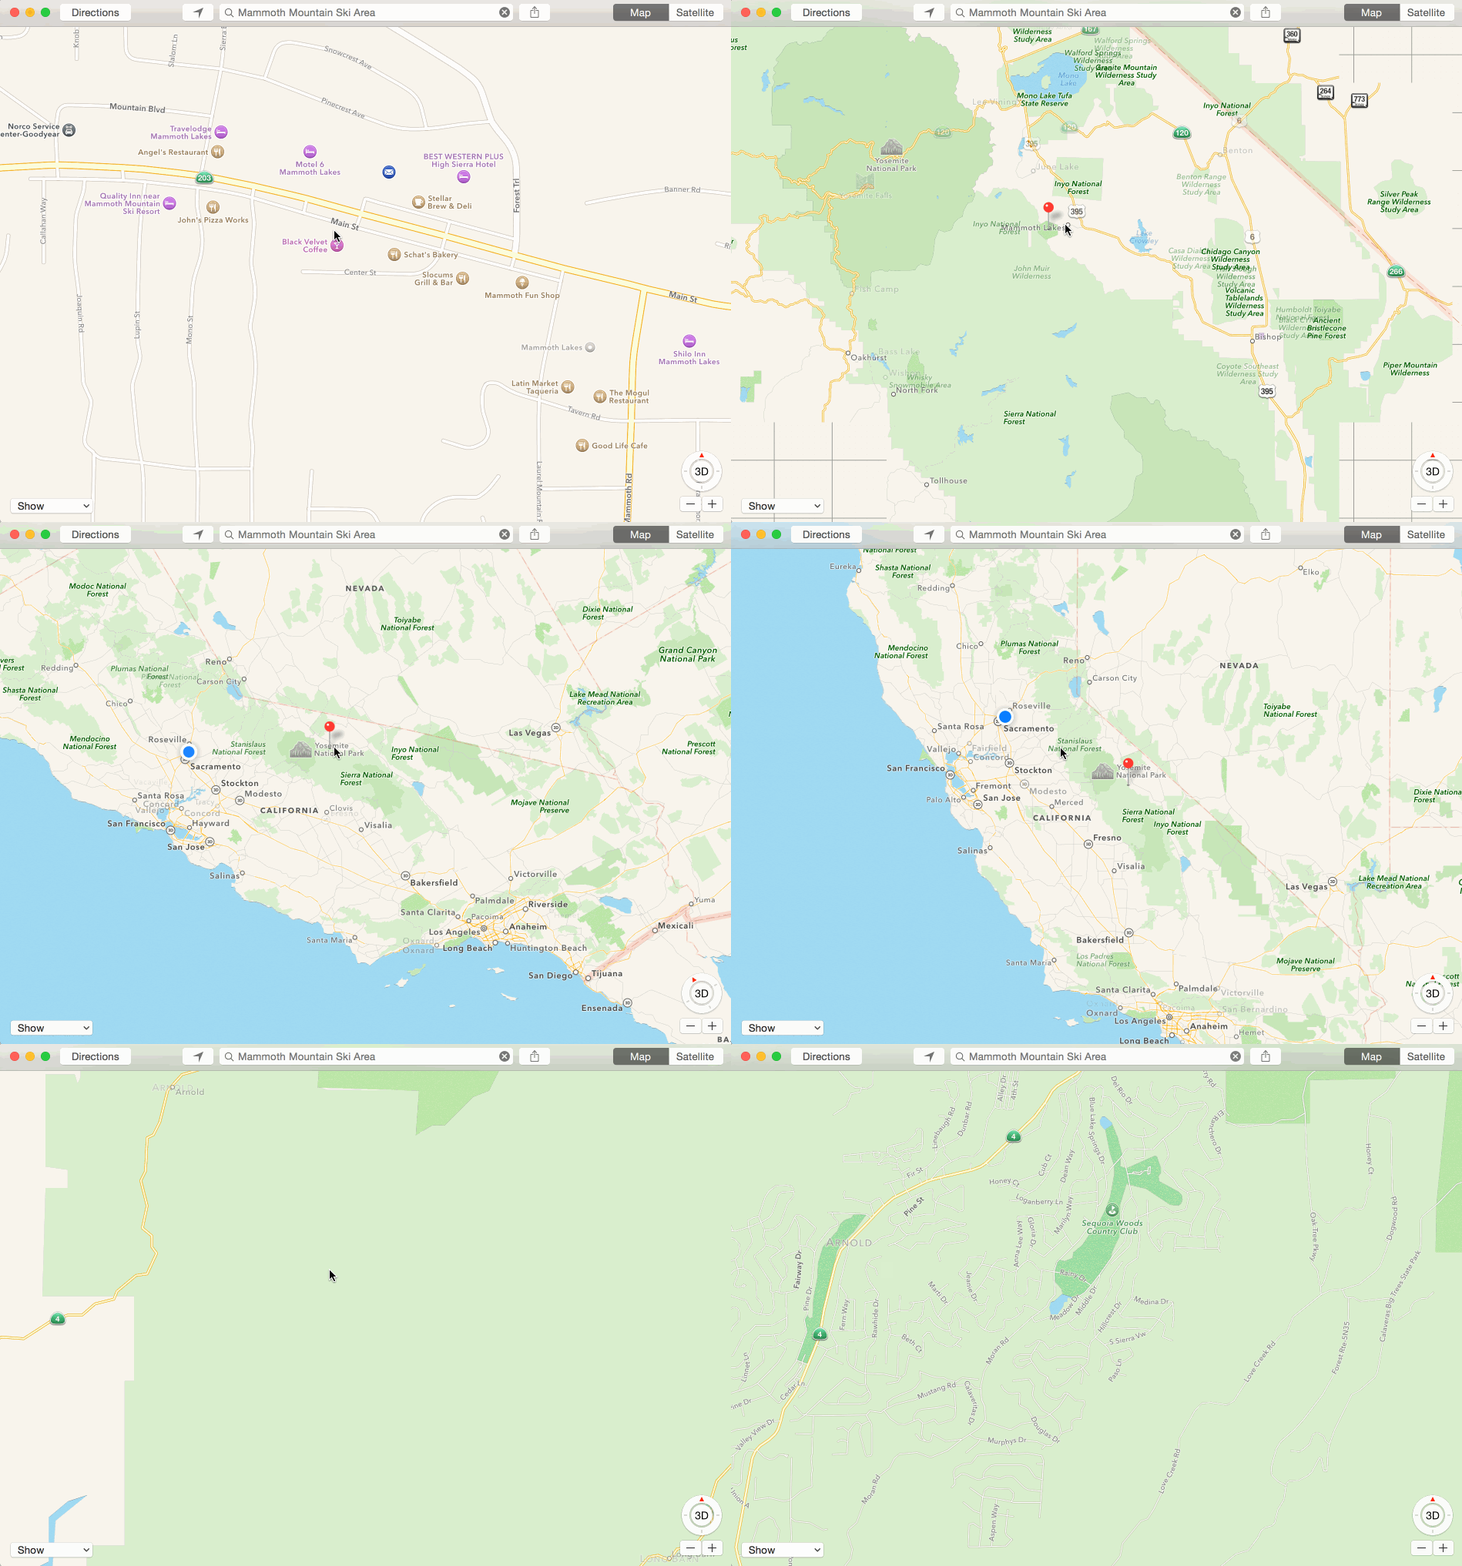
Apple Maps


Cesium


What is
?
OpenGL (Open Graphics Library) is a cross-language, multi-platform application programming interface (API) for rendering 2D and 3D vector graphics. The API is typically used to interact with a graphics processing unit (GPU), to achieve hardware-accelerated rendering.


OpenGL Pipeline





It is the tool you use to take data and turn it into pixels.
You have to do everything yourself...


WebGL
OpenGL
- JavaScript API
- GLSL
- Runs on Modern Browsers
- OpenGL ES 2.0 Spec
- C API
- GLSL
- Runs Natively
- Several Specs Out There...
They both take your data, put them in
buffers on the GPU -- allowing you to draw
with that data.


GLSL
GL Shading Language
Vertex Shader
Fragment Shader
Clipspace
Coordinates
Color
Vertex Shader + Fragment Shader = Program
1 app can = many programs


Buffer
A way of getting vertex and other per vertex data on the GPU.
gl.createBuffer - creates a buffer
gl.bindBuffer - sets that buffer as the buffer to be worked on
gl.bufferData - copies data into the buffer


Vertex Shader
Transforms each vertex's position in the model (vector tile coordinates) to the 2D coordinate at which it appears on the screen.
Setting a variable gl_position that gets the clipspace values for the current vertex.


Vertex Shader Data Sources:
Attributes - data pulled from buffers
Uniforms - values that are constant for all vertices in a draw
Textures - data from pixels / texels.


The vertex shader is called 1 x per vertex.


Fragment Shader
Provides a color for the current pixel being rasterized.
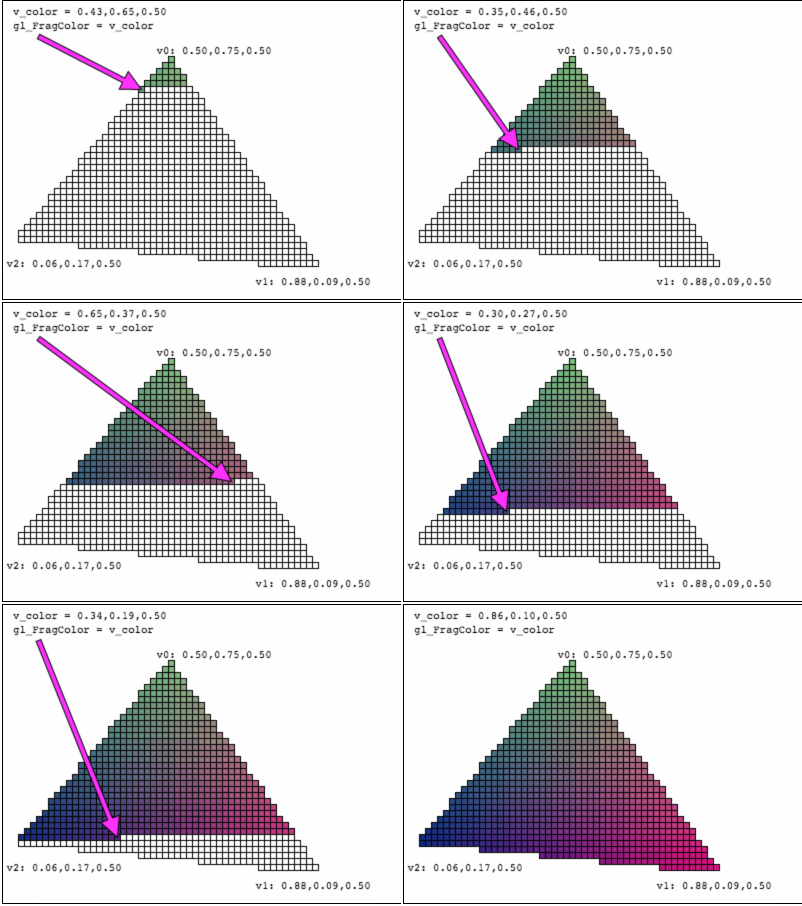
Sets the global variable gl_FragColor.


Fragment Shader Data Sources:
Varyings - data passed from the vertex shader and interpolated.
Uniforms - values that stay the same for every pixel of a single draw call
Textures - data from pixels / texels


The fragment shader is called 1 x per pixel.


What is a map renderer?
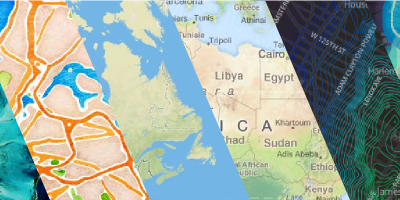


The process of rendering a map generally means taking raw geospatial data and making a visual map from it.


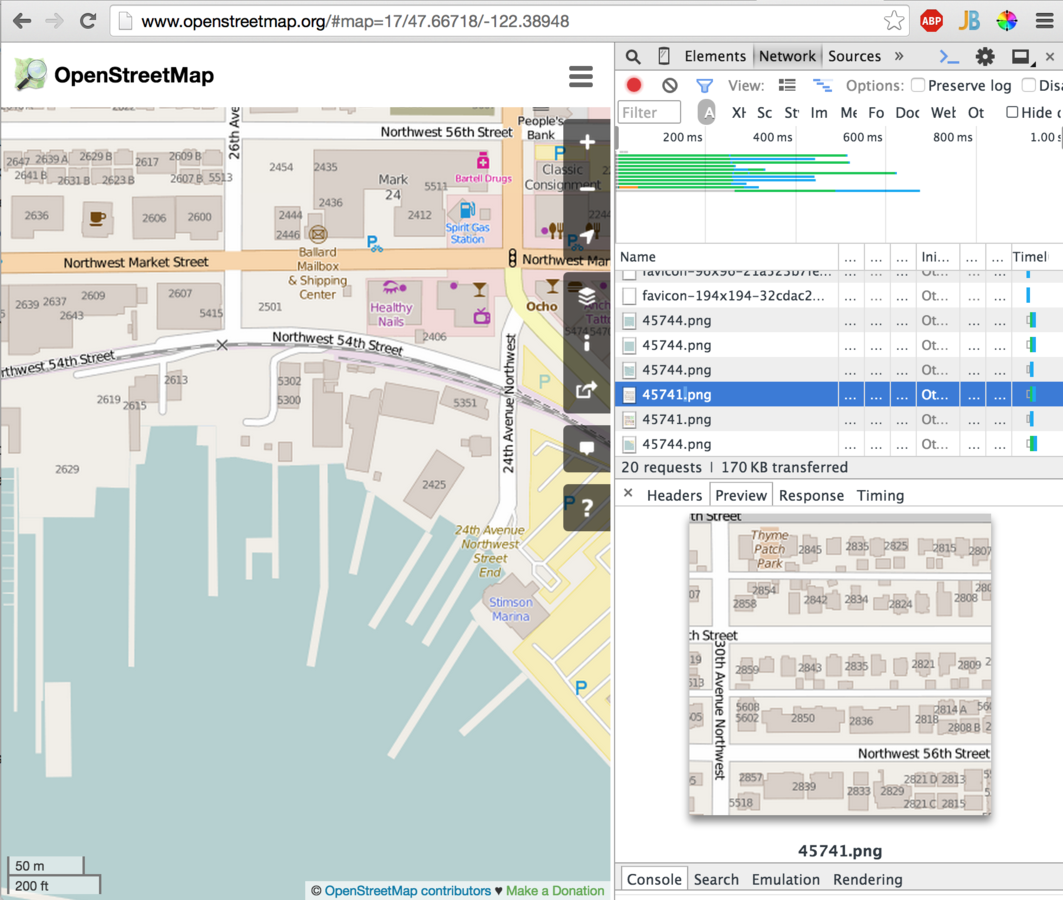
Mapnik
The most widely used open source map renderer.


Vector Tiles
Learn more about how vector tiles work on my Leaflet Vector Tiles presentation...


Vector Tile

The rendering pipeline of data to pixel is shared by Mapnik and the OpenGL map renderer.
A vector tile is an intermediate binary protocol buffer data format. This contains post projection vertices in the coordinate space of a web mercator tile.


The vector data is rendered to pixels on the fly, on your local machine with OpenGL.

Esri's Fork of mapbox-gl-js


Style Map On Device
Besides fluid zoom transitions and smaller source data, you can change the style of your map without loading any new data.


style.json
Rather than styling the map with CartoCSS or SLD, we have a style.json document that determines how the data is drawn on the map.
If you modify a value in the style sheet, all you have to do is call map.render()


MapboxGL
There are two Mapbox libraries that are currently being developed in parity:
WebGL
OpenGL ES 2.0


The amount of work that this "low level map renderer" is requiring to get to a production level library is extensive...
But, it will completely change how maps look and behave for the rest of the industry outside of Google and Apple.


Cartographic Challenges


Line Anti-Aliasing
GL does draw lines, but it only knows to turn on pixels in between vertices...


Fonts
You have to make your own "glyph atlas" and used signed distance weighting from the glyphs to set your font size...


Tracking
and kerning...

